COTBase - Premium
- 60 Futures markets (+11 Market complexes) analyzed
- Covering all data types (Classic, Disaggregated, TIFF, CIT)
- Covering all report types (Futures only, Futures and Options, Options only)
- 14 datasets to base your analysis on (Net positions, etc.)
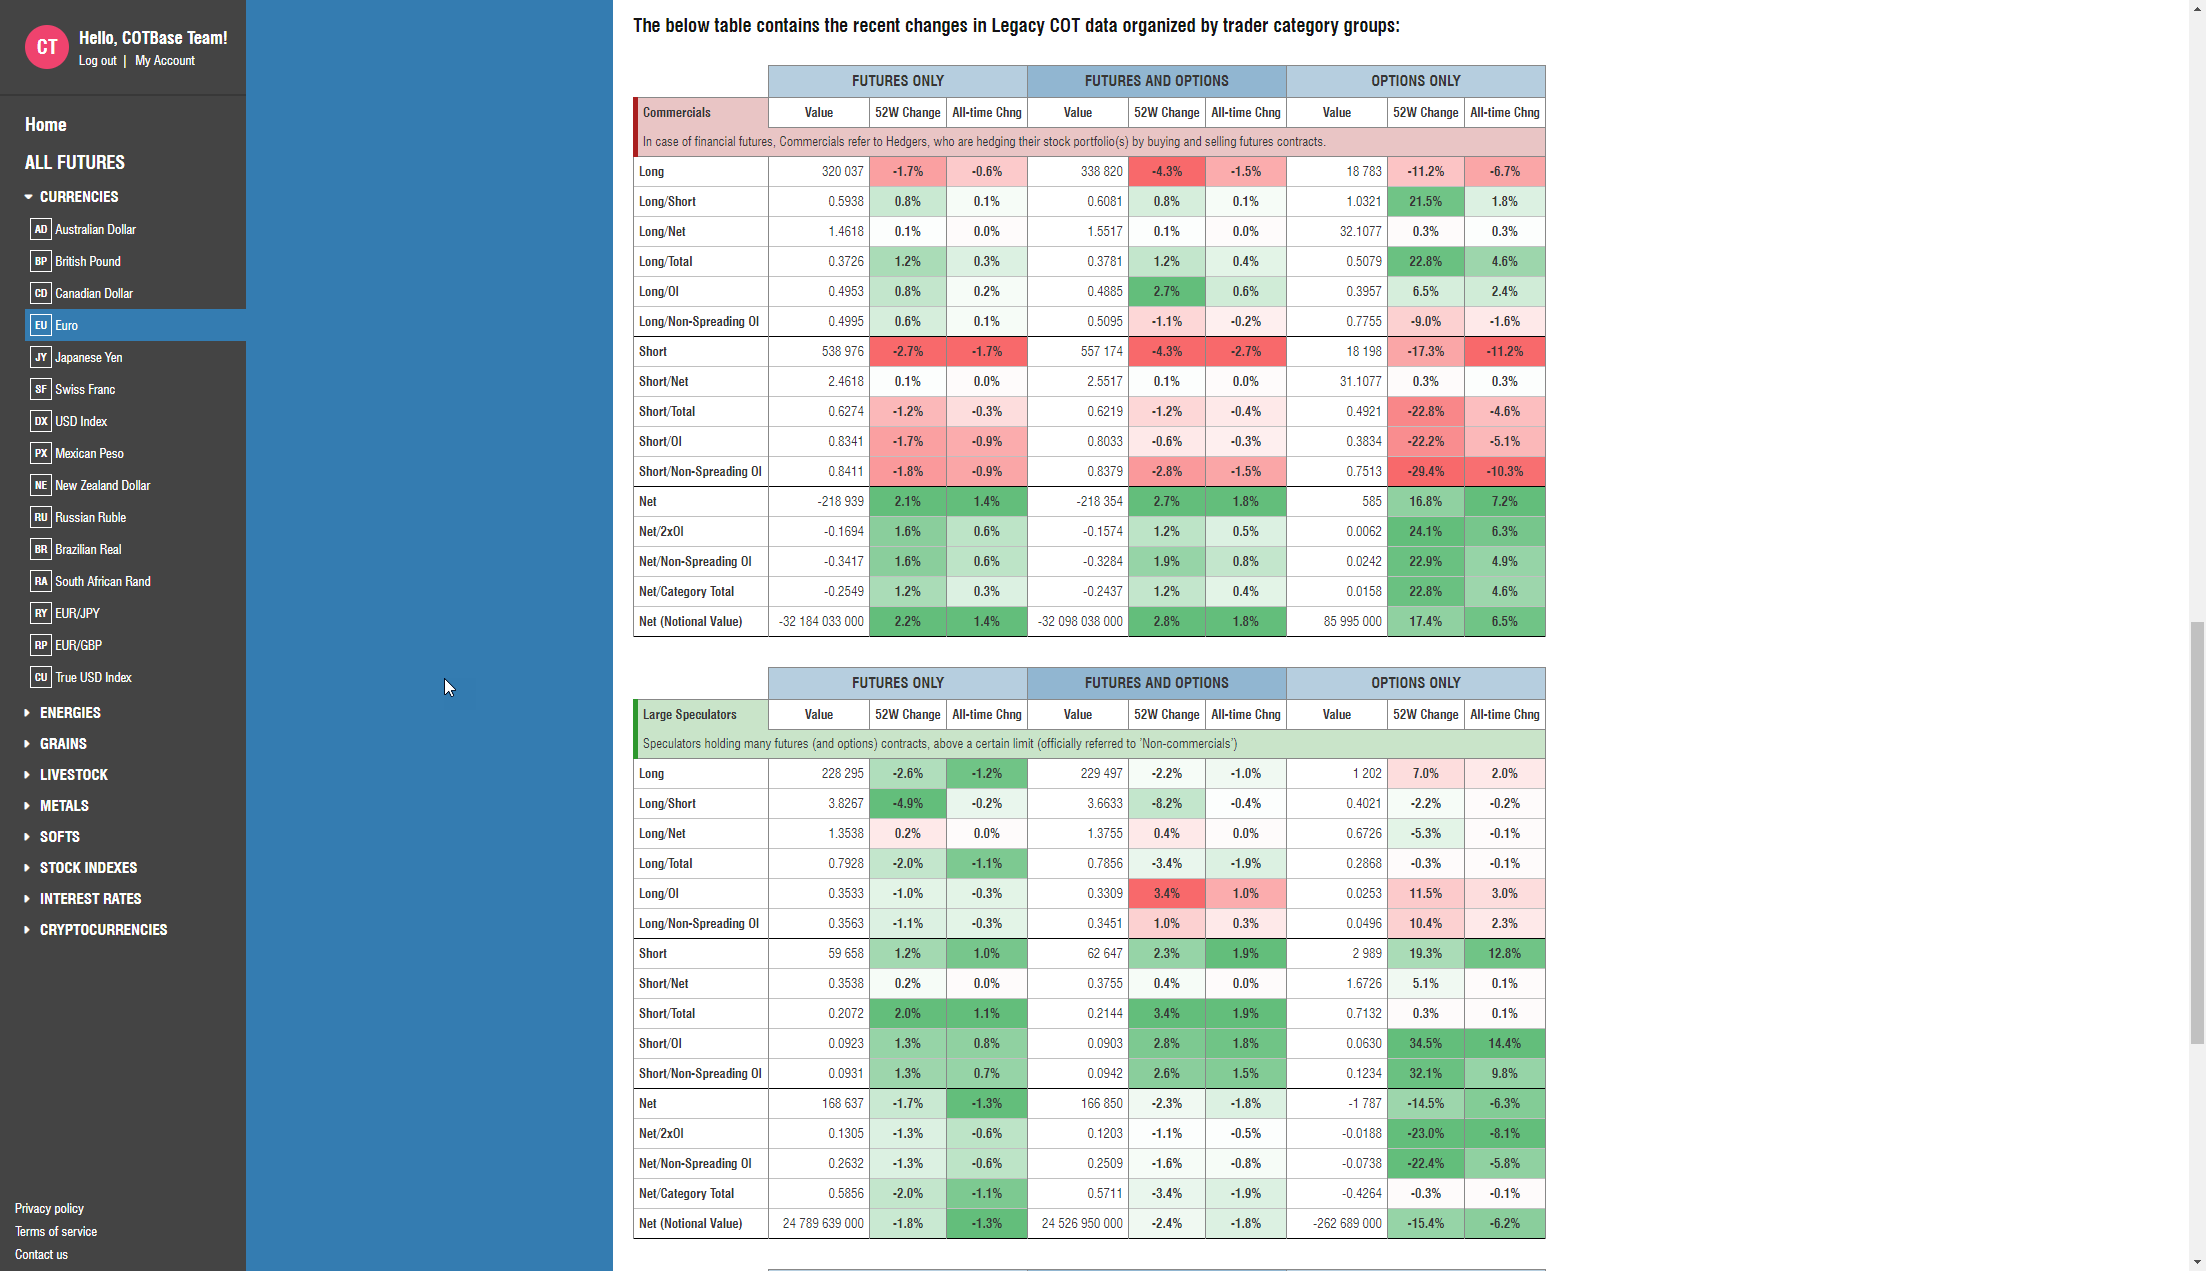
- Analyze COT Changes, COT Extremes, COT Indexes and much more
- Interactive charts (all your analysis on charts by one click)
- Bonus: Volume and Open Interest analysis
Our data
Corrected and combined
We correct for past contract size changes (eg. one wheat contract used to represent 1,000 bushels of wheat - now 5,000 bushels), and combine mini and normal contracts. Most other Commitments of Traders data services use uncorrected, raw COT data!
Market complexes
Our subscribers get extra 'markets' to analyze. These are the complexes that we made up from combining COT positions from more markets into one. We do that by creating the USD equivalent of COT positions and add them up. These data can help you analyze better the following markets and/or market groups: Soybeans, Wheat, Grains, Agriculture, Livestock, Metals, Stock indexes, Interest rate, the US Dollar and Bitcoin!
Futures and options Options only added!
We analyze Futures only, Futures and Options and as a recent addition, Options only COT data! We are the only providers on the market who analyze these data sets simultaneously.
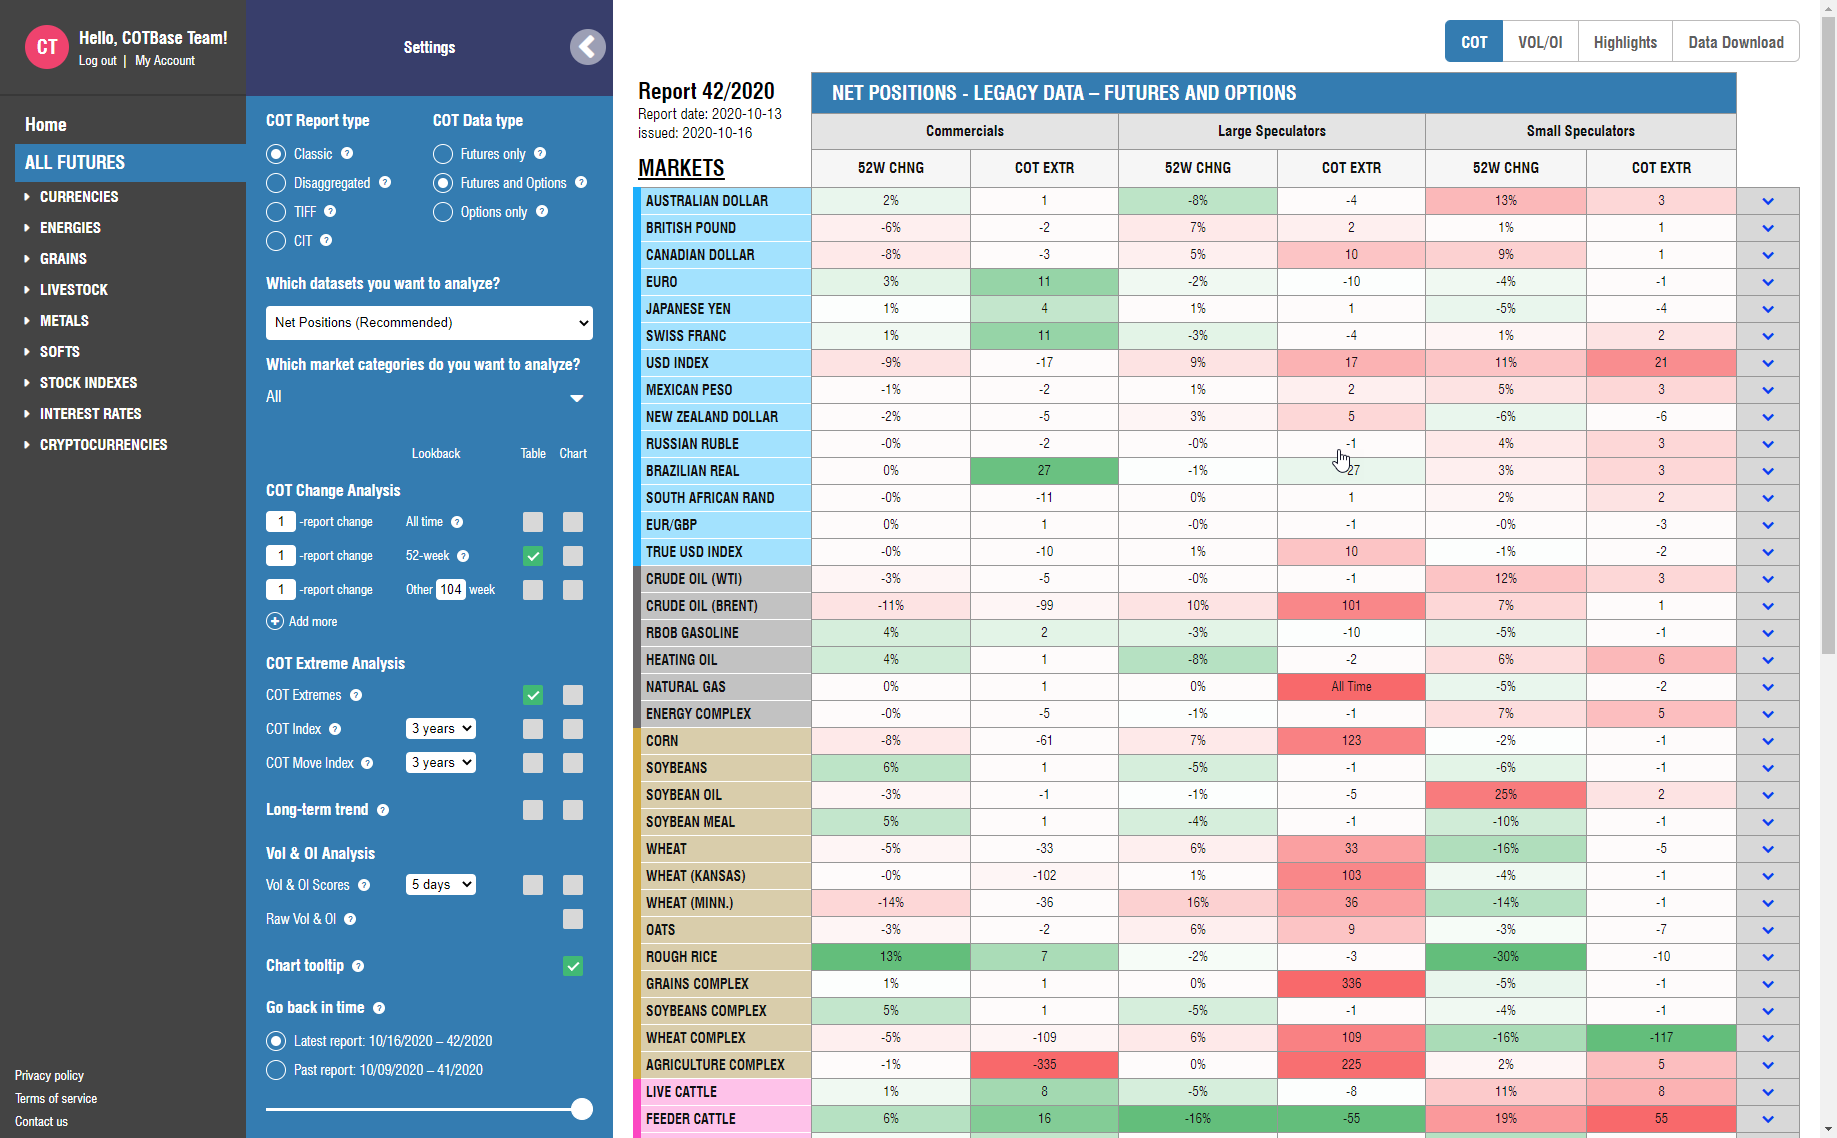
All reports Important
Besides the classic (legacy) COT data, we analyze Disaggregated, TIFF (Traders in Financial Futures) and CIT (Commodity Index Traders) data as well! There are no other sources on the web currently, that offer such a deep and wide service on charting and analyzing COT data.
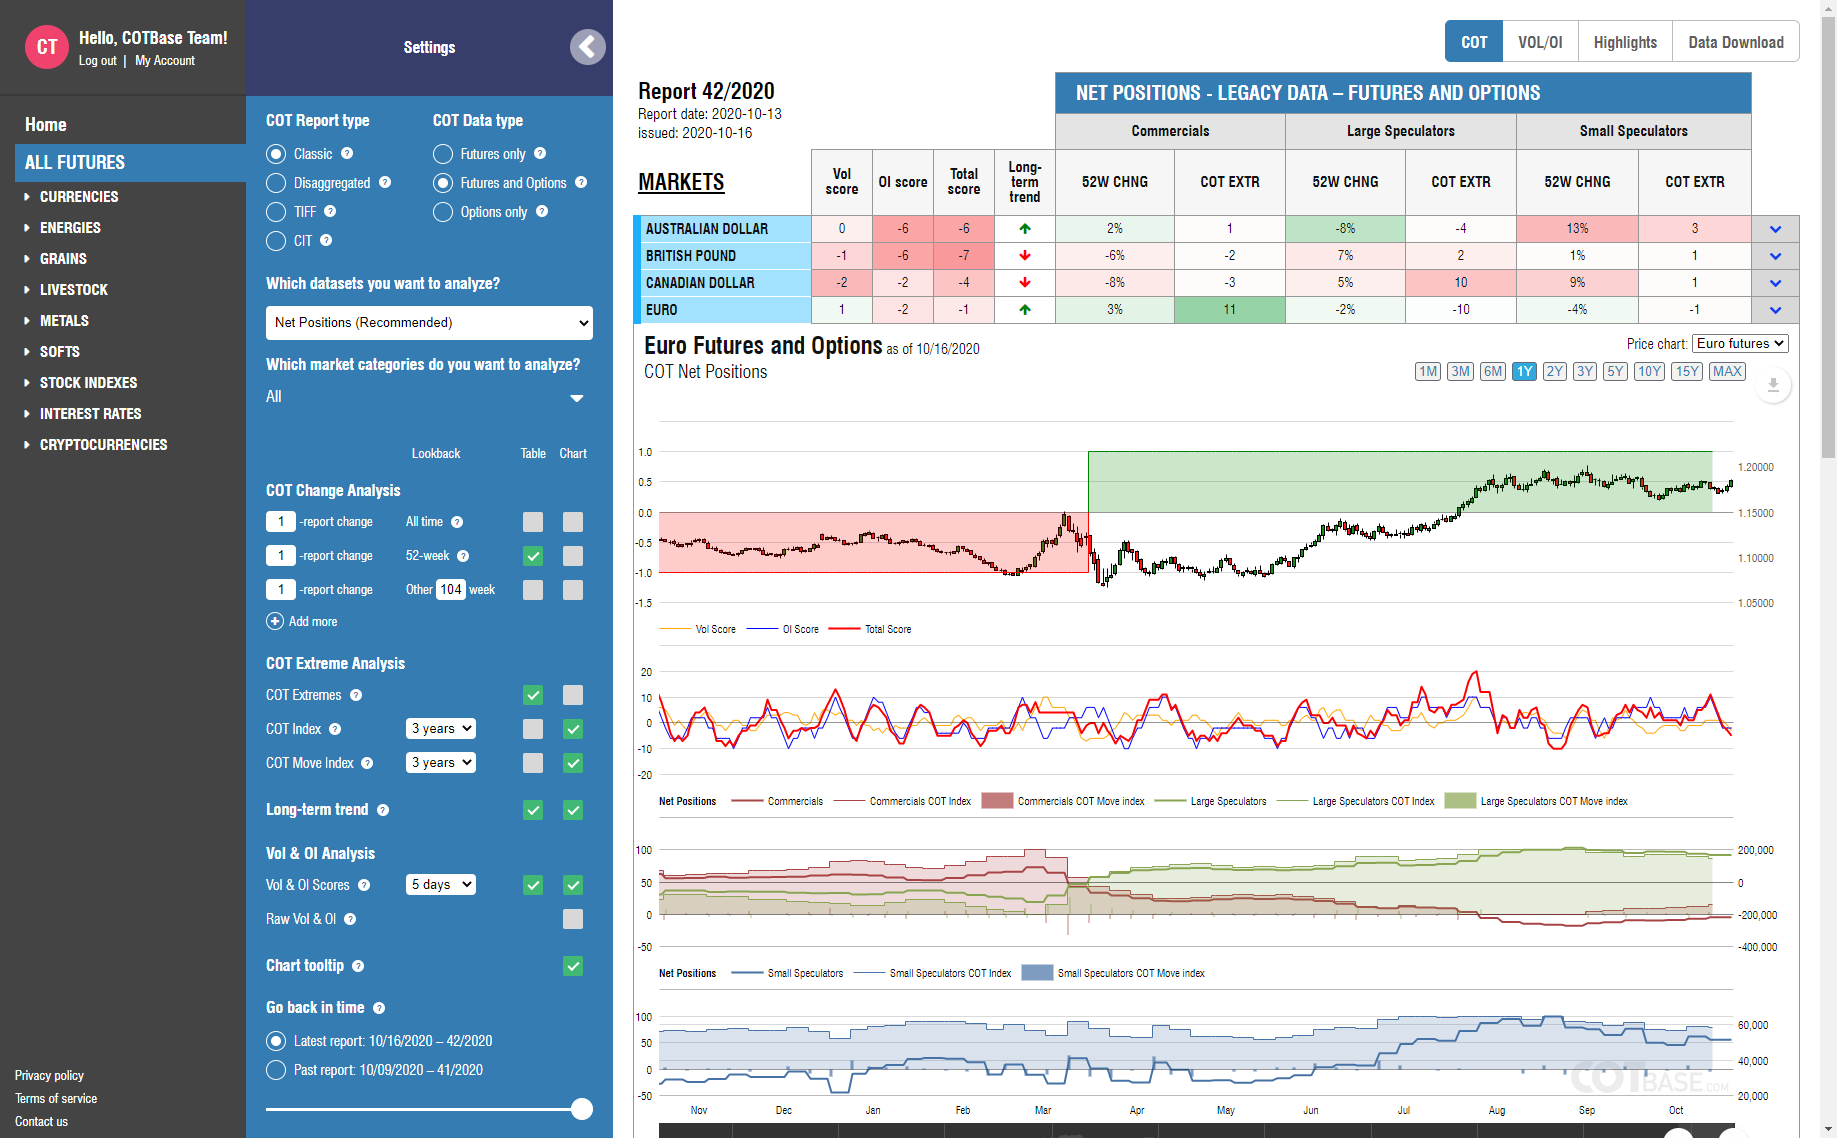
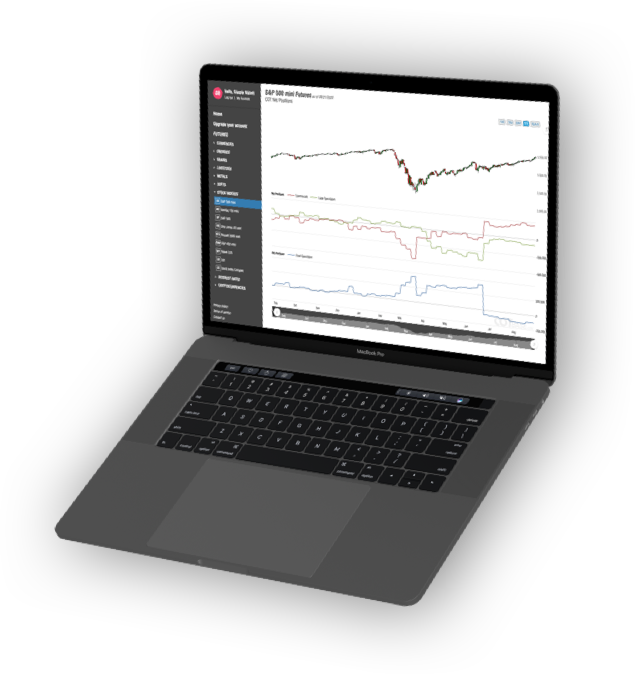
Our charts
Handy
We separate Small speculators on our charts to make the movements more viewable. In many cases the best clues come from these traders, so we make watching the small guys much easier, than on your standard COT chart. Also, we use a hover crosshair to help you track and pinpoint signals. If you subscribe, you will be able to scroll back in time, check out previous examples of COT signals and get a better feel on the characteristics of various markets.
Versatile
Subscribers can choose any time period between 1 month and the maximum data available (as far as 1986 in case of certain markets) to chart. When charting market complex COT data, any member of the Market complex can be chosen for display.
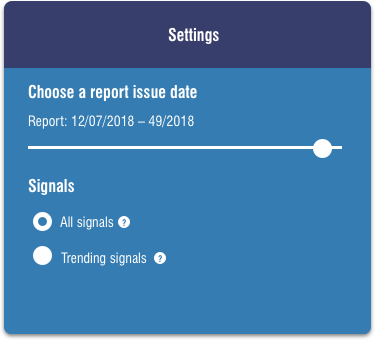
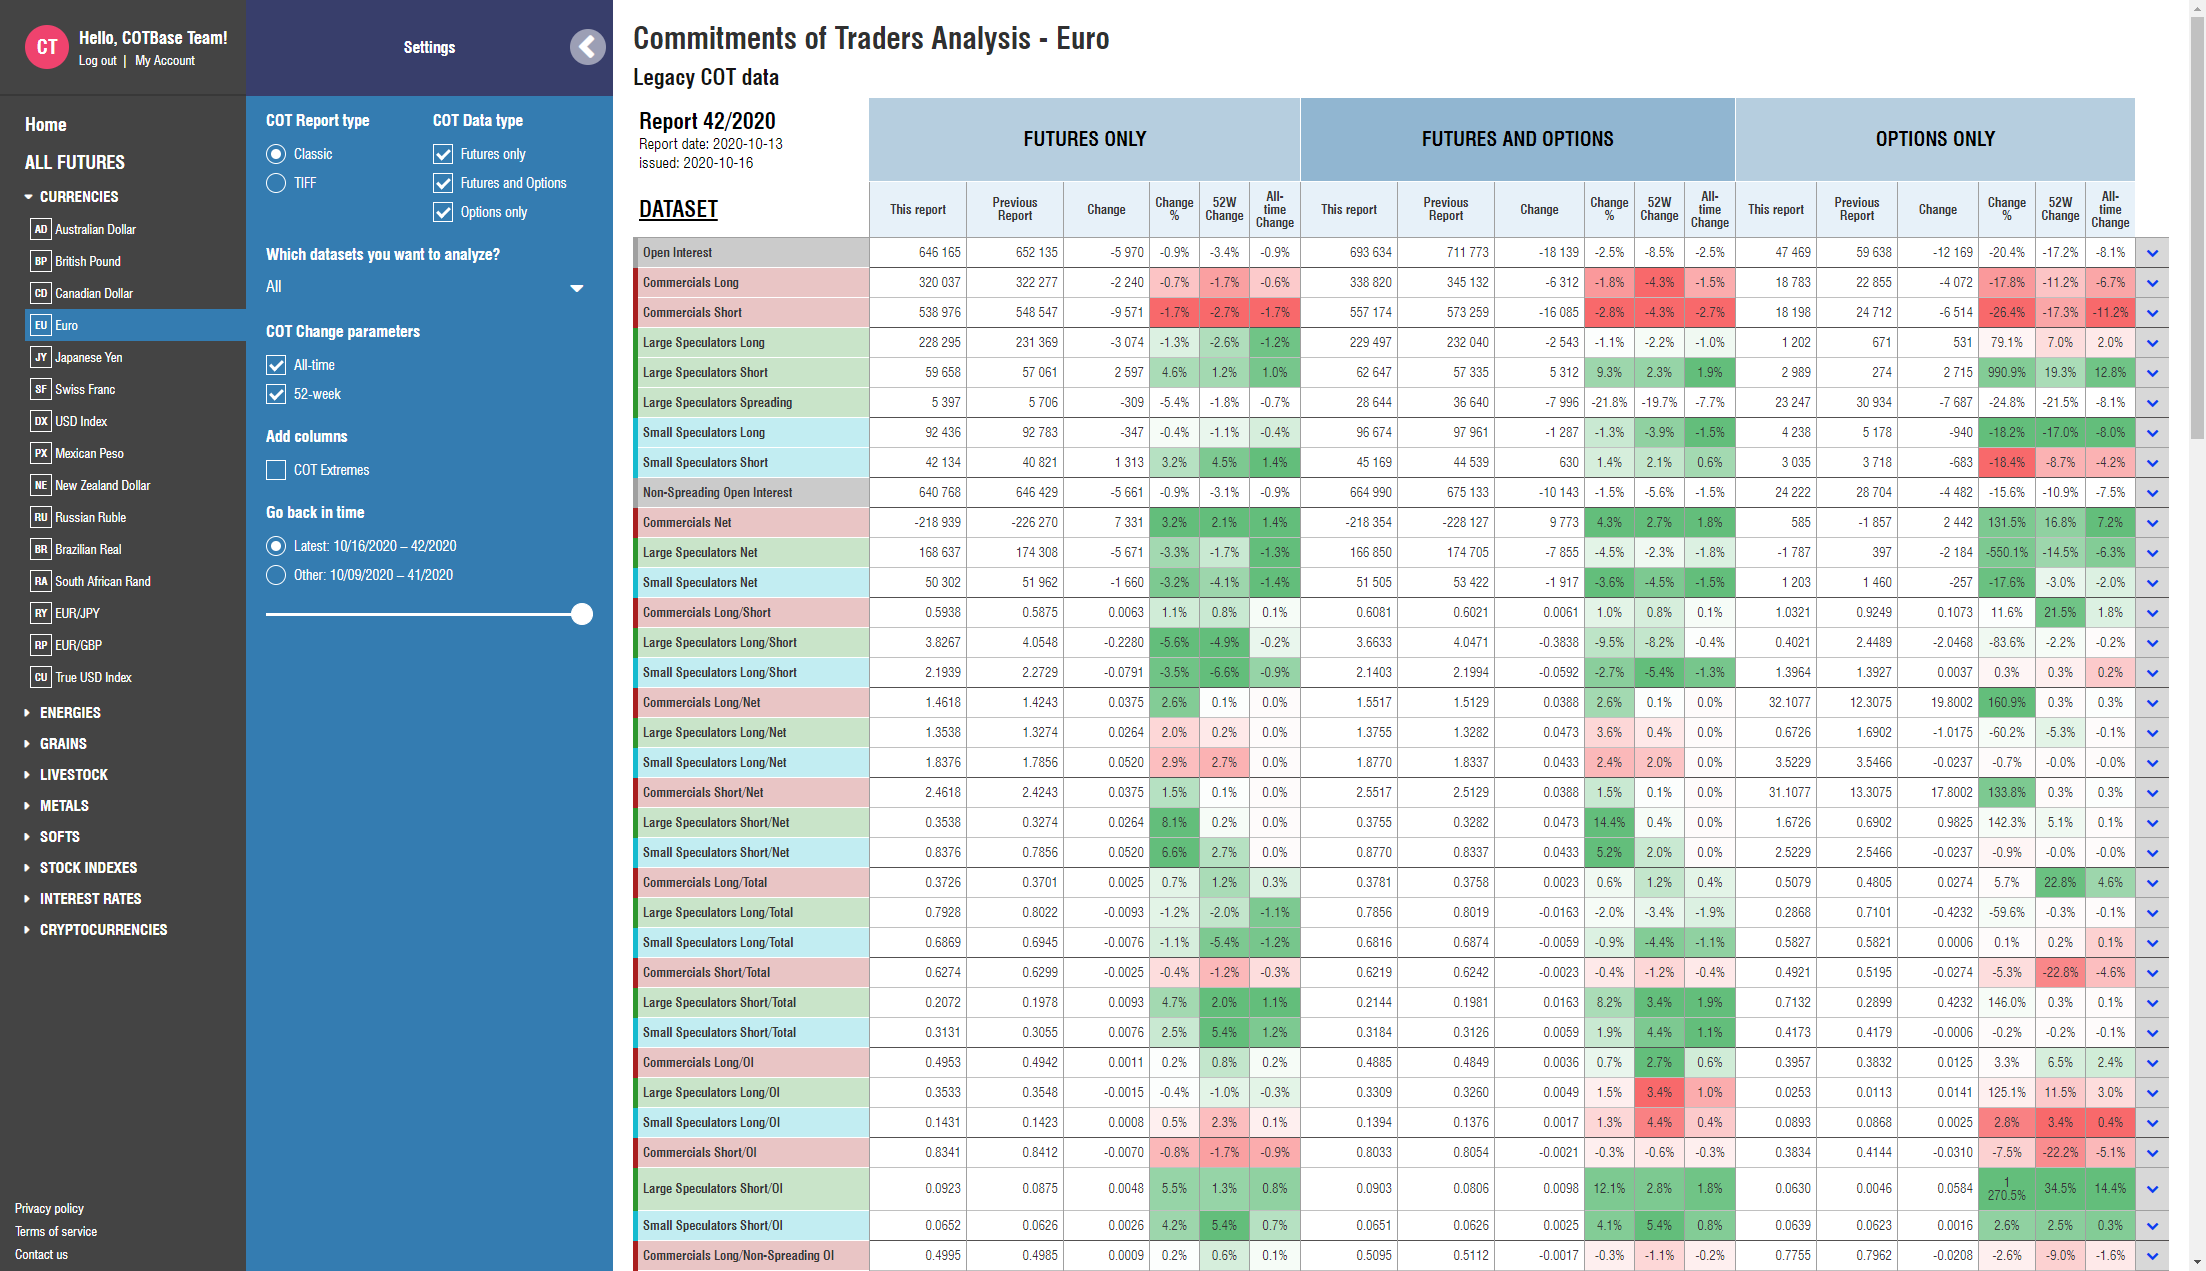
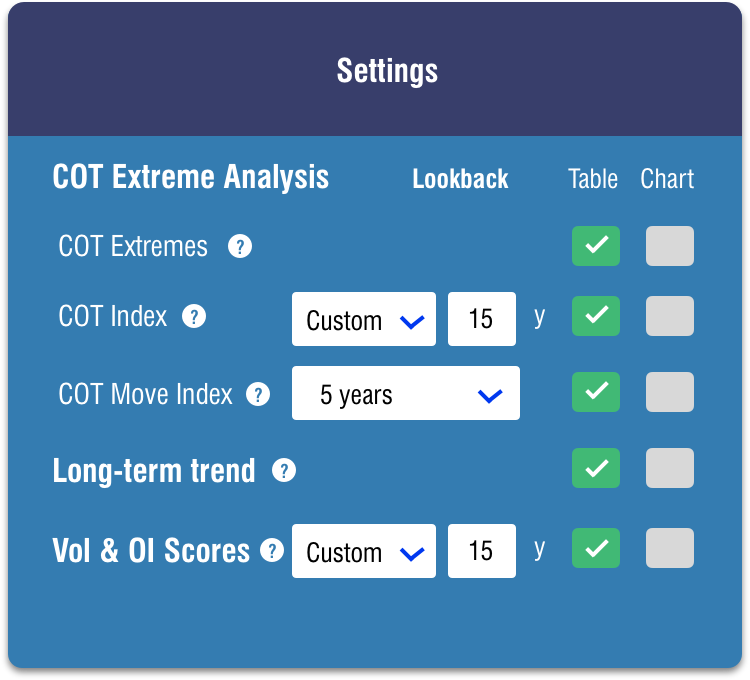
Extremes
We track the extremes of net COT data, since those are the most effective trading signals according to most COT research (check out the Resources section). COT Indexes are widely known, show the position of the current COT reading compared to a previous time period. Our subscribers can calculate their own COT Indexes using any lookback period, on all trader groups! COTbase designed another extreme tracking measure, that shows how many reports ago did the current reading occur. In case the current reading in COT moves has never occurred before, our system will issue an 'All-time' extreme signal.
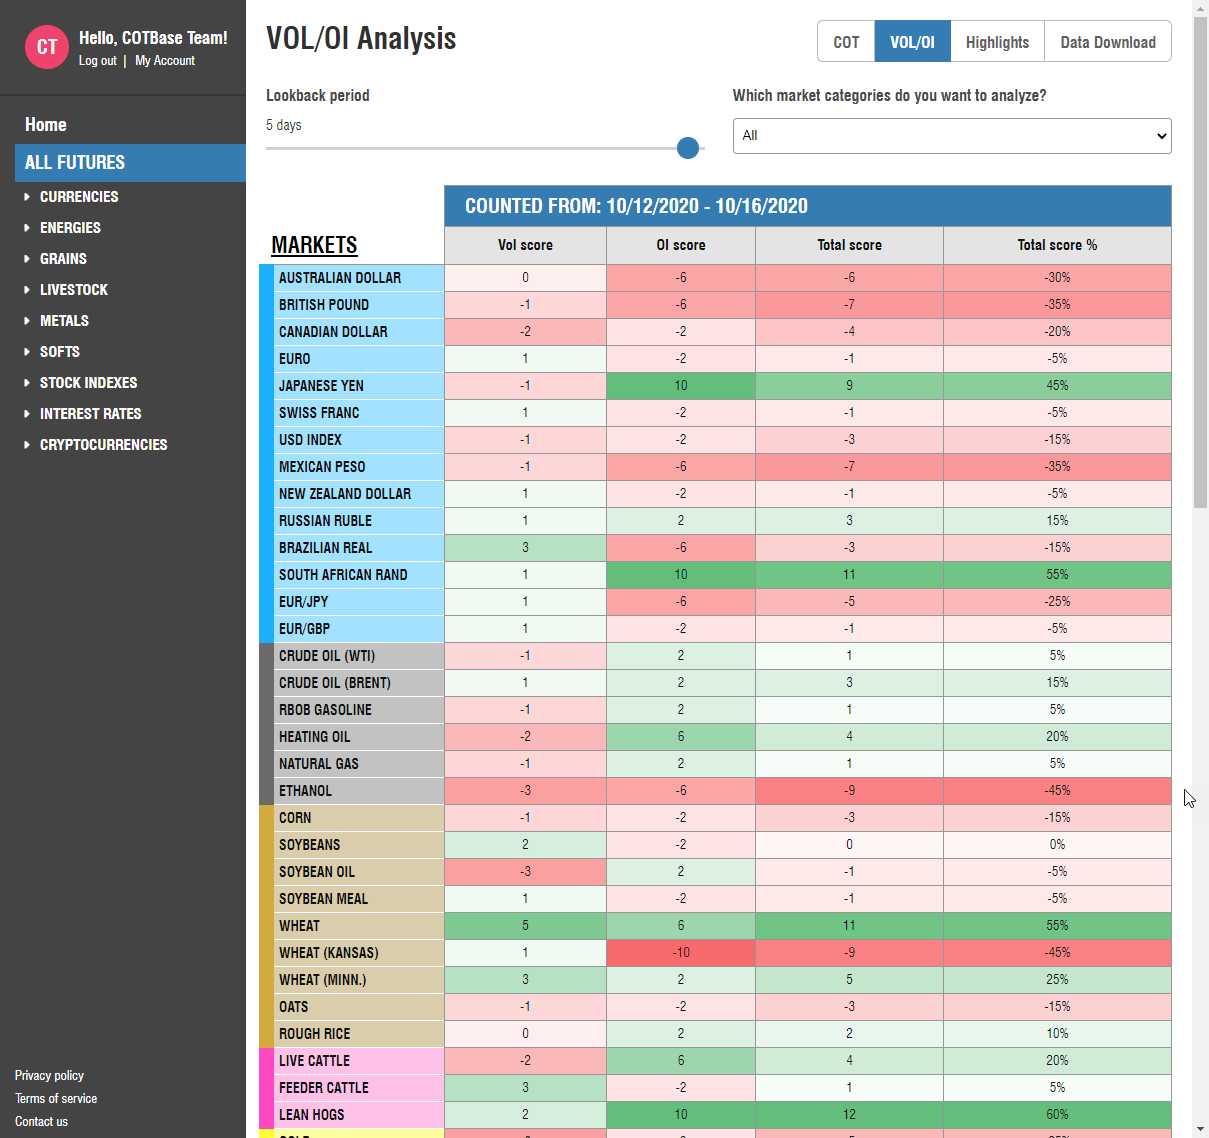
Volume and open interest
We include a Volume and Open Interest scoring system, both in the COT analysis table for convenience and also under a separate tab. You can set the lookback period for which you would like to get the scores - the higher the scores the more bullish is the market - negative scores are the opposite.
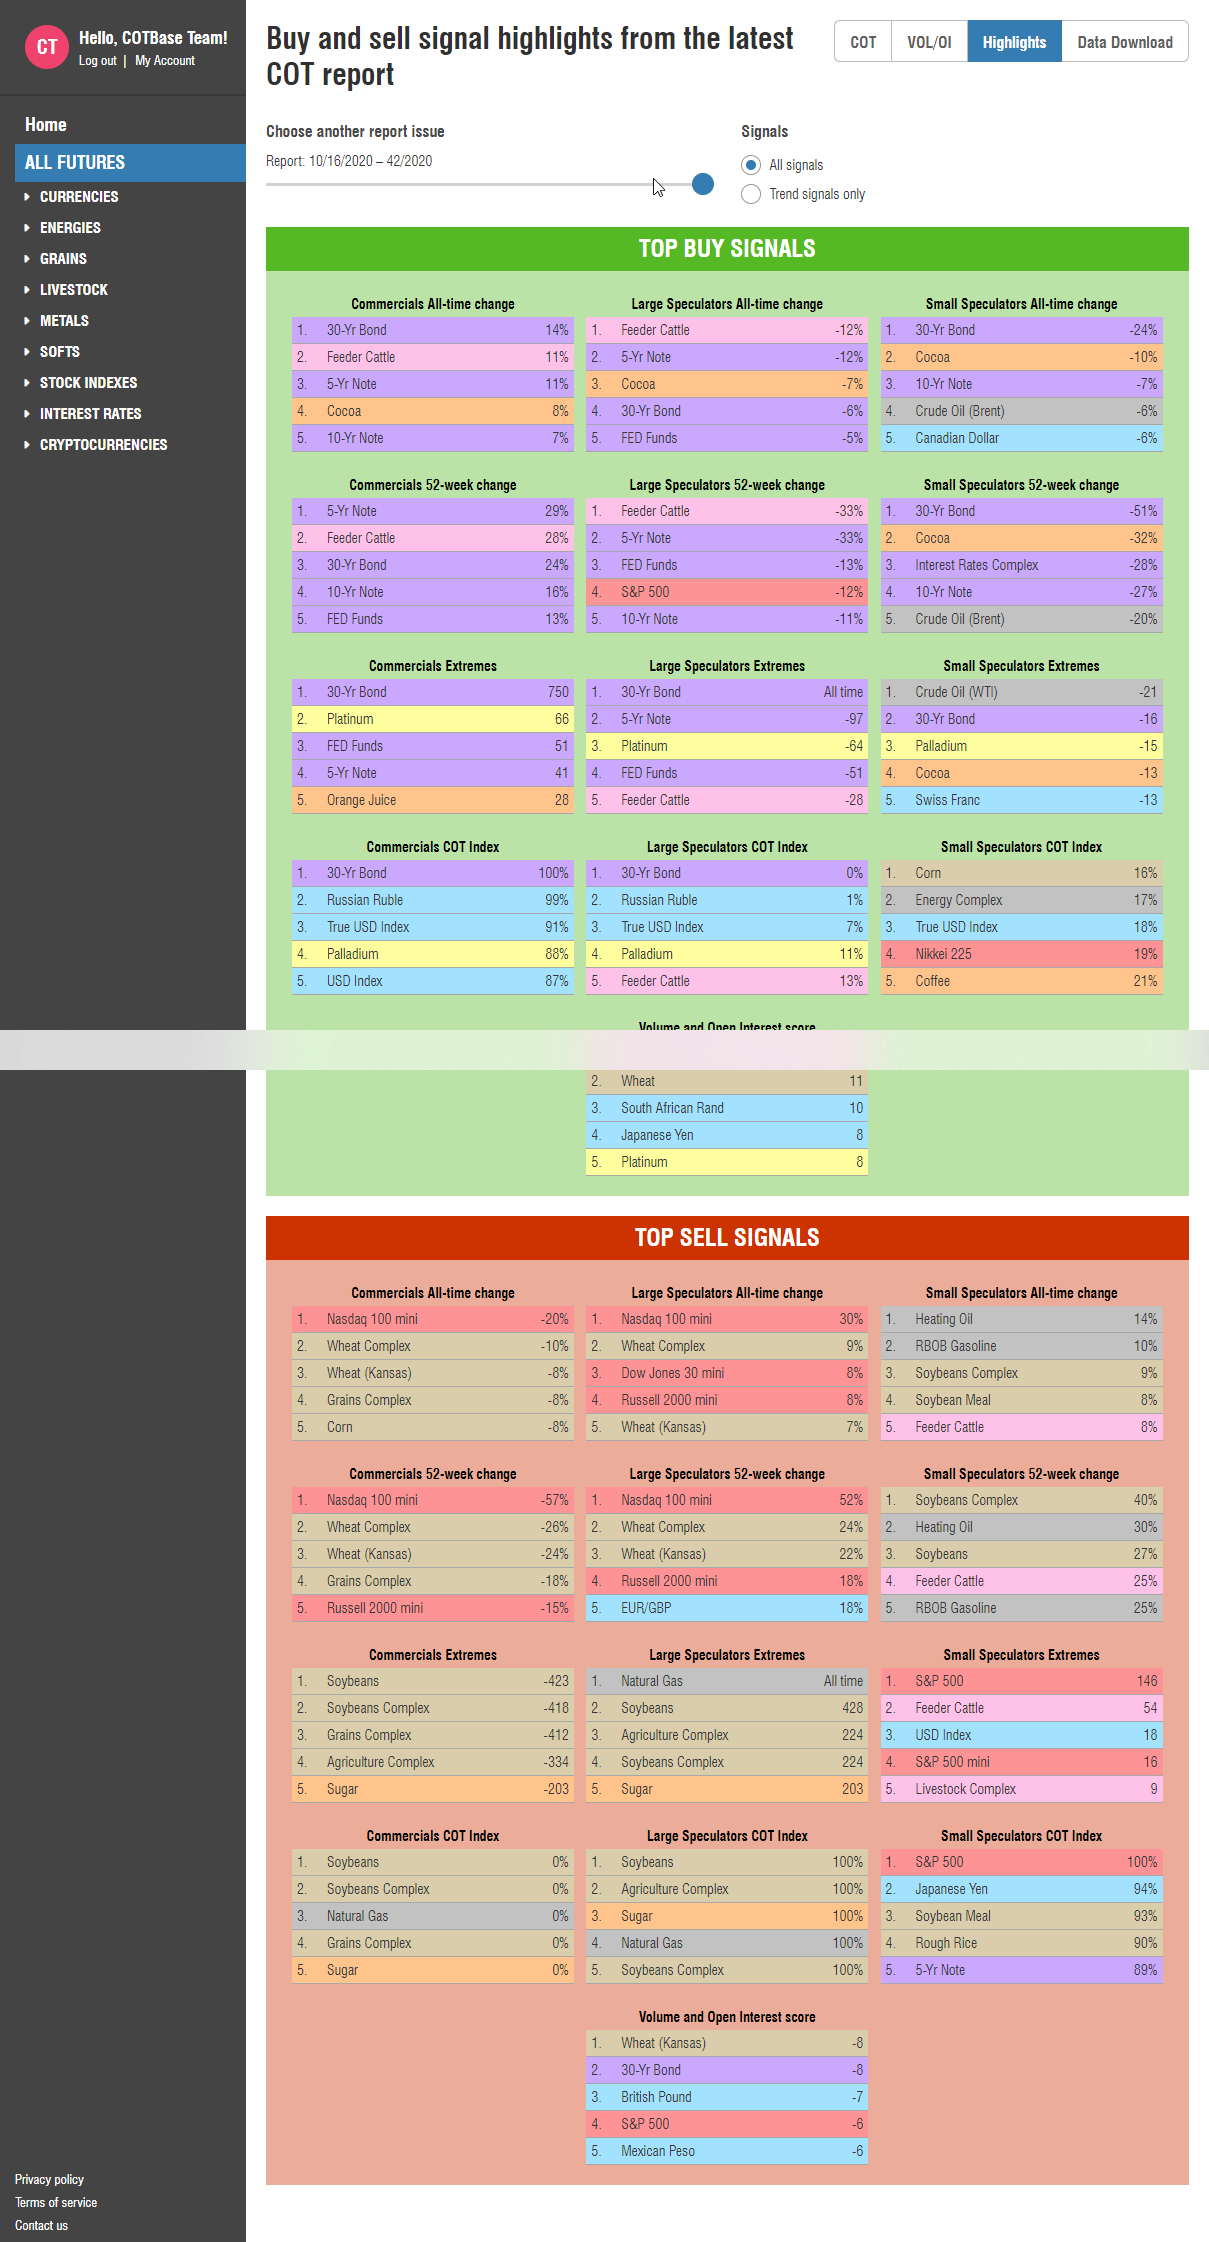
Highlights
We collect the important COT and Volume/Open interest signals on one page to show which markets are the best long and short candidates.